Sunday, April 12, 2015

4/08/15: Work-Kinetic Energy Theorem Lab 11

Purpose: By performing three different experiments, we are to determine how the work done on a cart by a spring compares to the change in kinetic energy of the cart. The work-kinetic energy theorem states that W = ∆KE.

Experiment 1

Apparatus:


The set up consists of a motion detector, track, force probe, spring, and cart.
We will be measuring the work done and spring constant when we stretch a spring through a measured distance. After setting up the apparatus, we made sure to calibrate the force sensor and to reverse the motion setting on the motion detector so the slope of our graph would be positive. We next opened the file called L11E-2 (Stretching Spring) to display a force vs. position axes. Once ready, we hit collect  and moved the cart slowly towards the motion detector until the spring stretch about 1.0 meters. Once logger pro generated our graph, we analyzed it and determined the spring constant is simply the slope of the force vs. position graph and the work done is the area under the force vs position graph.

We determined our spring constant k = 2.735 N/m and W = .4519 J


Experiment 2: We will be using the same set up, but the cart will be stretched a distance and the data will be collected once we let the cart go. Once logger pro generated our graph, we entered a formula in a new calculated column that would allow us to calculate the kinetic energy of the cart at any point. 

We are able to use the velocity vs time graph as well as the mass of our cart (.339 kg) to find the kinetic energy of the cart at any point. 


Once we had our calculated kinetic energy column, we then arranged the axes to read (kinetic energy and force) on the y-axis vs (position) on the x-axis. We used the integral fit on the force vs. position graph and compared it to the area under the kinetic energy vs. position graph. We analyzed the graph at three different section to make sure the work-kinetic energy theorem holds true and it certainly did.

Work done by spring = .3044 J and the ∆KE = .298 J


Work done by spring = .5326 J and ∆KE = .534 J


Work done by spring = .6354 J ∆KE =.638 J
This equation hold true. The work done by the spring is equal to the change in kinetic energy of the cart. 

Experiment 3: We were shown a video of a machine pulling back a large rubber band and the force exerted on the rubber band was recorded. It was then attached to a cart of known mass, stretched and released. The cart passes through two photogates, which are a known distance apart. The time it takes was also recorded. With the down distance and time, we can calculate the final speed of the cart and thus the final kinetic energy of the cart. 

Force vs. Position for the machine stretching the rubber band. 

By breaking the graph into various segments, we are able to calculate the work which was equal to 25.675 J. 

We then calculated the kinetic energy of the cart, which was equal to 23.8 J.

These values did not match exactly, but we still know the theorem holds true. 

Some possible errors for part 3 could be that since we estimated the heights and basses of our graphs, the end results will be slightly off and the equipment used in the experiment may not be as accurate as the equipment we are able to use today. 


Conclusion: By performing three experiments, we were able to determine a spring constant, analyze a force vs. position graph to find the work done from stretching the spring, verify that the work done by a spring is equal to the change in kinetic energy of a cart, and analyzed a video to further prove the work-kinetic energy theorem holds true.

Friday, April 10, 2015

4/1/15: Centripetal Force with a motor Lab 9

Purpose: Use our knowledge of centripetal force to derive an expression/model for ω and to compare our model to a measured value of ω in order to describe the relationship between ω and ø.

Apparatus: The apparatus was already set up before beginning the experiment. An electric motor mounted on a surveying tripod will spin a horizontal rod mounted on a vertical rod and as the motor spins with ω, a rubber stopper attached to the horizontal rod by a string will revolve around the central shaft. As we increase ω, the stopper revolves at a larger radius and ø increases. As the stopper spins, it will strike a horizontal piece of paper on a ring stand a distance h above the ground. 


Procedure: Before we derived our model for ω we needed to measure and record the distance from the ground to the horizontal rod (H), the distance from the vertical rod to the string (R), the distance from the ground to the horizontal piece of paper (h), and the length of the string to the stopper (L).


To begin deriving our model we will need to use Newtons 2nd Law on the rubber stopper. 


We were able to find ø by looking at the right triangle with hypotenuse L and height being H-h.

We next spun the stopper at six different ω's using six different voltages. Each time we increased the voltage we created and measured a new h. From this data we can find ø.


Once we derived our model for ω, we found the measured value for ω by timing how long it took the stopper to make 10 revolutions around the shaft (T) and dividing it by 10 to get the time for 1 revolution.


Below is a table of our gathered data that we can use to test our model for ω and see how it compares to the measured omega. The last two columns are the values we were most interested in. 


Below is a graph of measured ω vs. modeled ω. 


By using a best fit line, we see the graph increases linearly and has a slope close to 1.
This tells us that our experimental data compares well with our measured data and that our modeled equation for ω is reasonable for calculating angular speed. 

Conclusion: Although our model correlates well with the measured values of ω, there is still always some uncertainty in our measurements. The period T had an uncertainty of +/- .01 seconds and h had an uncertainty of +/- .5 cm. 


When we plotted measured ω vs modeled ω, each different value for T and h introduced some uncertainty within each of our points. This is why the slope of our graph is not exactly one. 


The final outcome of this experiment is that we were able to successfully derive an expression for ω from an apparatus that was set up in class and test it with a measured ω. It was found that as ω becomes larger, ø becomes larger. 

Sunday, March 29, 2015

3/25/15: Centripetal Acceleration vs. Angular Frequency Lab 8

Purpose: Use an accelerometer to determine the relationship between centripetal acceleration and angular speed.

Materials: An accelerometer mounted onto a disk and a scooter wheel used to revolve the disk such that the accelerometer passes through a photogate positioned on a pole.


Procedure: The disk was spun using the scooter wheel and the amount of time to complete 10 rotations was recorded at six different speeds. The distance of the accelerometer from the center of the rotating disk was also measured as well as the accelerometer reading corresponding to each speed.

We recorded and were able to generate six different speeds using six different voltages: 4.8, 6.2, 7.8, 8.8, 10.8, and 12.6. a is the centripetal acceleration, t(0) represents the time the first rotation occurred through the photogate and t(10) represents the time at which the 10th rotation occurred. 

Centripetal acceleration is calculated using the formula a=v^2/r, where v=rω (How we relate linear speed to angular speed). Therefore, a=rω^2 and by rearraging to solve for r, we can find the radius. An acceptable value would be 13.8 - 14.0 cm. 

ω = 2π rad / time for 1 rotation.


After running and recording six different speeds, we input our values into logger pro to generate a graph of acceleration vs. angular speed^2 and compared our slope with the acceptable value. 


the last two columns were calculated columns. 


ω was calculated using 10 rotations from t0 to t10


Once we input an equation into the calculated columns, we generated our plot. Using a best fit line, the value for our radius was .1371 m or 13.71 cm. 


Conclusion: The slope of the graph above displays the radius of the disk 13.71 cm. As the theory predicts, if we increased or decreased the angular speed or acceleration, the radius would do the same. Some sources of error could have been friction from the wheel on the disk or the tape slightly grazing the photogate. Another source of error to note is that t0 does not always begin exactly when time is 0 seconds. This means the tapes initial position was slightly different for each trial. 

Saturday, March 28, 2015

3/23/15: Trajectories Lab 5

Purpose: To use our knowledge of projectile motion in order to predict the distance a ball will travel before impacting and inclined board.

Materials:

  1. aluminum v-channel
  2. steel ball
  3. board
  4. ring stand with clamp
  5. carbon paper
  6. tape
  7. ruler
  8. plumb bob
A complete set up of the apparatus
Procedure Part 1: Once the apparatus has been set up, we launched the steel ball from an identifiable point on the v-channel to see where it would land. We placed the carbon paper at the impact point on the floor and launched the ball five more times to get a more accurate distance of how far out from the tables edge the ball landed. We hung a plumb bob as well to get even more accuracy. After observing the marks on the carbon paper we used a meter stick to measure the distance from the edge of the table to the impact point. 


The measured horizontal distance was 0.734 meters. We were asked to determine the launch speed of the ball, so we needed the vertical height as well, which was 0.874 meters.


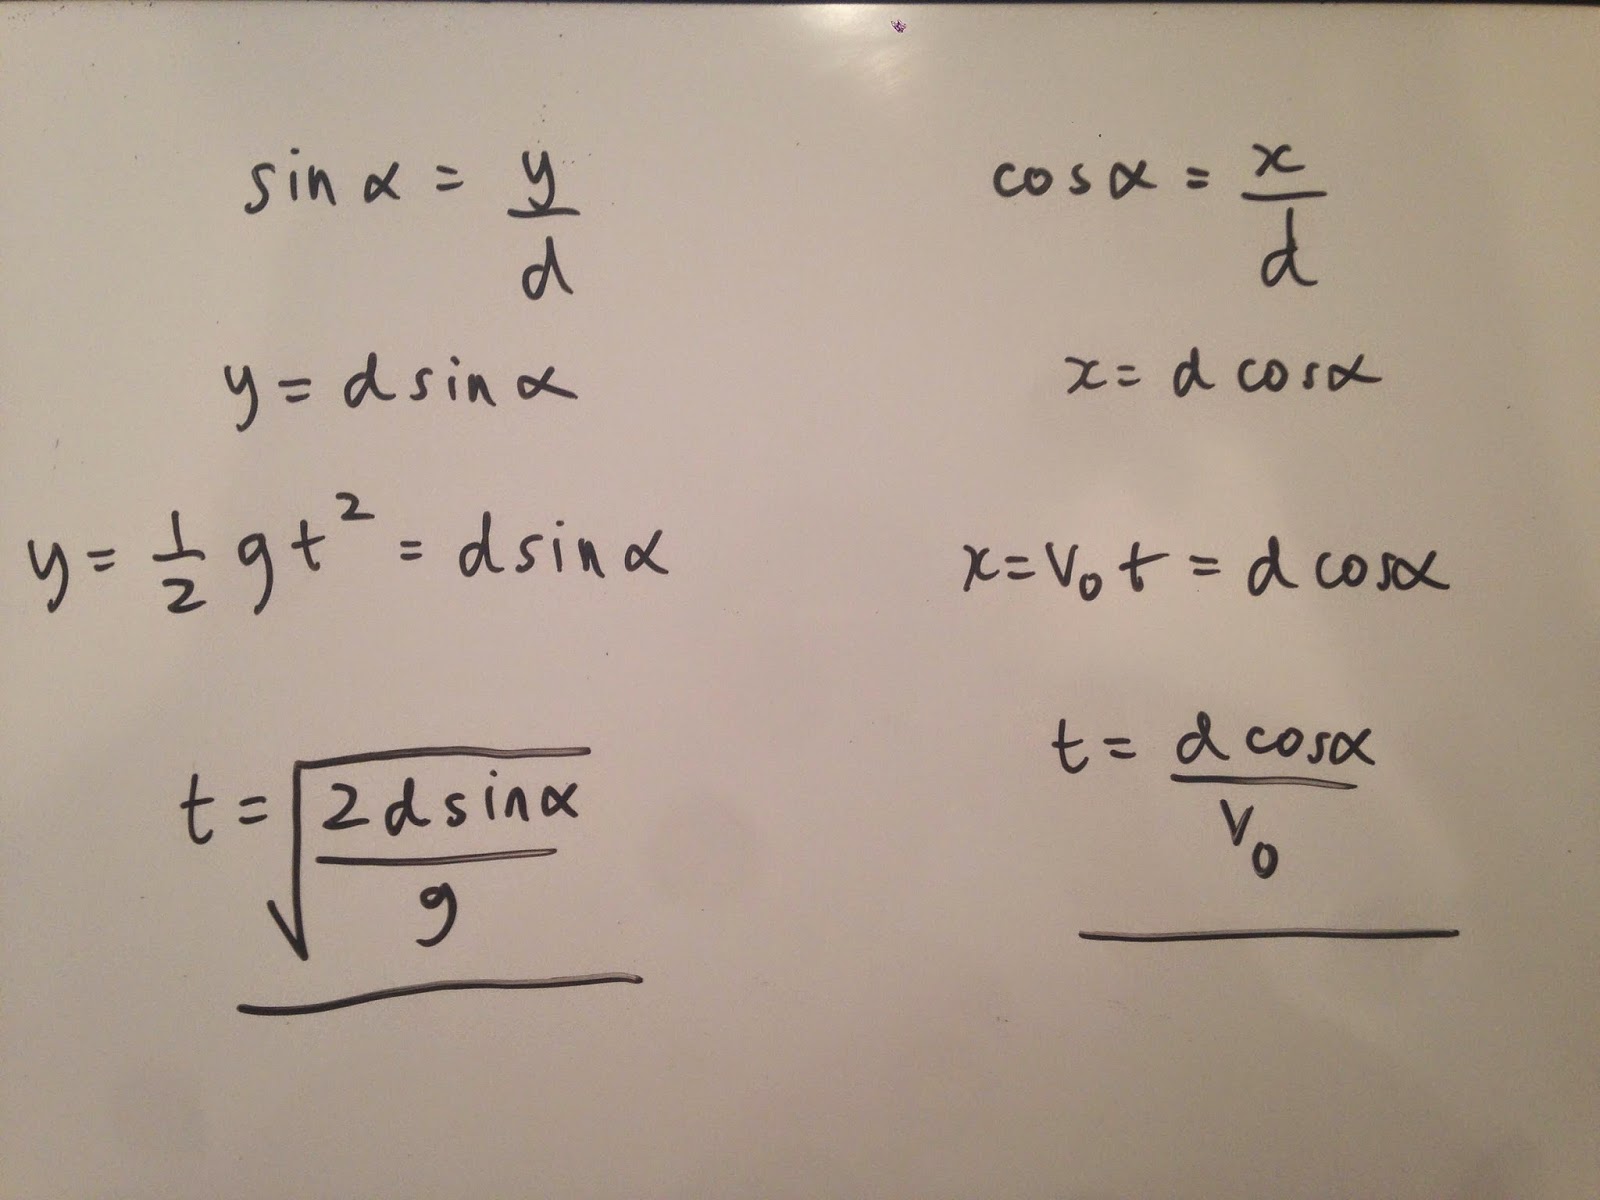
Using kinematics in two dimensions, we calculated the time the ball was in the air using the vertical height and gravity. Once we had the time, we were able to determine the speed.


The time in the air is for both x and y components, but the initial velocity is only in the x direction.   


Procedure Part 2: After calculating the launch speed, we had to imagine attaching an inclined board at the edge of the table and when launched from the same position, the ball will strike the board a distance d along the board.


The horizontal distance was 0.835 meters and the vertical distance was the same as in part 1.
We measured the angle α to be 46.3º using tan^-1(y/x)


Given that we know the values of v0 and α, we derived an expression that would allow us to determine d along the board. 


Our experimental value of d was 0.947 meters. 


Once we determined d we set up the apparatus again, but with the board held in place by a weight and tape. 


We then placed the carbon paper along the board a distance d, based on our experimental value and launched the ball five more times from the same initial point as in part 1. 


The mark inside the red square is the impact point along the board. We next calculated the uncertainty in our experimental value of d.


In our derived equation for d, we needed an expression for v0 that represented a function of x and y. we started with the equation v=x/t and used the x and y components of the projectile to create an expression for v0 that we could plug into our propagated uncertainty formula. 

Our uncertainty for measuring the distance in the x and y direction was +/- 0.01 m and the uncertainty for the angle was +/- 0.0174 radians.
Above is the experimental calculations for d. 

Conclusion:

The equation used in calculating percent error

Our calculations showed that d = 0.936 m +/- 0.125 m. Our measured theoretical value was 0.890m. This yields a % error of 5.17%, which shows our experimental value compared well to our theoretical value. Possible sources of error could have been accidental moving of the board or v-channel. The v-channel was constantly being readjusted due to slipping. We could have easily avoided this by using tape. 


Sunday, March 22, 2015

3/18/15: Modeling Friction Forces Lab 7

Purpose: To apply Newton's laws throughout five different experiments in order to determine the coefficients of kinetic and static friction.

Part 1 Static Friction:

We will be determining the coefficient of static friction using a pulley, wooden block, and cup. Below is an image of how to set up the experiment.


A wooden block with the felt-side placed on the table and a string attached to the block. A cup is attached to the string which hangs over the table by a pulley.
The procedure goes as follows:
  1. Weigh a wooden block and record the mass. The system should be at rest before beginning. 
  2. Carefully add water to the cup until the block begins to move. Record the mass of the cup.
  3. Record the mass of another wooden block and place it on top of the existing block. Record the total mass of the blocks.
  4. Carefully add water again to cup just until the blocks move. Record the mass of the cup with water.
  5. Repeat this process until you have four blocks stacked on top of one another
  6. By the end, a total of four different values of mass for the blocks and four different values of mass for the cups with water should be recorded.
Below is the collected data and free body diagram of the set up


We will input this data in to logger pro to determine the maximum coefficient of static friction.


Below is a data table consisting of our values input into logger pro


The force of friction should equal M Water + cup, which is the mass of the cup with water. We made sure to convert grams to kilograms. 


To determine the coefficient of static friction we plotted a friction force (N) vs. normal force (N) graph. The slope of the graph is our coefficient which was 0.3093.


Part 2 Kinetic Friction:

We will be measuring the coefficient of kinetic friction using a force sensor, wooden blocks, and string. Before beginning we made sure to calibrate the sensor with using a 500 g hanging mass. Using the same wooden blocks as before, we pulled the block across the table at constant speed, recorded the data in logger pro, and repeated this process until we generated four different graphs. By pulling the blocks at constant speed, the force of kinetic friction will equal the force of the pull. 


Once all four graphs have been created in logger pro, we determined the mean force exerted on each stack of blocks and generated another graph to find the coefficient of kinetic friction.

The mean value is the force exerted on each block. These values were the graphed and the slope of the graph represented to coefficient of kinetic friction. 
Friction (N) vs. Normal Force (N)
Our value was 0.2531. This makes sense seeing that the coefficient of kinetic friction should be smaller than the coefficient of static friction.

Part 3 Static Friction From A Sloped Surface: 

Again we will be measuring the coefficient of static friction, but this time using only a track and wooden block. We began by placing the block on a horizontal track, slowly raising one end of the track until the block started to slip. We then measured and recorded the angle the track made with the horizontal.


We were able to determine the coefficient of static friction by drawing a free body diagram and summing up the forces in the x and y direction. The force of static friction is equal to mgsinø because there is no acceleration in the x direction. We figured out µs is simply equal to tanø. 


Part 4 Kinetic Friction From Sliding A Block Down an Incline:

We will now be measuring the coefficient of kinetic friction. We set up a motion detecter at the top of a horizontal track steep enough so that a block will accelerate down the incline. We measured the angle of the incline and used a velocity vs. time graph to find the acceleration of the block. With this information we can use a free body diagram to again find µk. 


Set up of experiment
We used logger pro to collect a position vs time and velocity vs time graph. The slope of the velocity vs time graph is the acceleration of the block.


A free body diagram drawing of the set up and sum of all the forces leading to µk.


Part 5 Prediction the Acceleration of a Two-Mass System:

This last experiment we will take our coefficient of static friction and use it to derive an expression for what the acceleration of the block would be if we used a hanging mass heavy enough to accelerate the system. The set up used is a track, motion sensor, hanging mass, wooden block, pulley, and string. 


Below is a free body diagram and an equation we derived for the acceleration of our system. Based on µk we determined the acceleration to be 2.675 m/s^2.


We next used logger pro to generate a velocity vs. time graph and found the slope from the graph to be 1.137 m/s^2. Our values did not quite match.


Conclusion:

For this experiment, we determined µs and µk for various situations. We saw how pulling a mass at constant speed leads to µk being equal to the force our pull generated. We learned how to calculate µs from something as simple as raising a track and recording the angle it made with the horizontal when the block slipped. To tie it up, we used our value for µk to predict the acceleration of a system.